
Breathing and heartbeat are the physiological processes necessary to maintain the body's normal metabolism and functional activities. In the fields of life detection and medical research, the simulation of heartbeat model is needed. MATLAB is a high-performance numerical calculation and visualization math software launched by MathWorks in 1982. It can be used to solve various discipline problems, including signal processing, image processing, neural network, control system identification, etc. Using MATLAB to simulate the heartbeat breathing can greatly improve the simulation work efficiency.
1 Vital signal characteristics analysis
The regularity of life signals is mainly reflected in the low heart rate and breathing rate. Under normal circumstances, the number of heartbeats is about 70 to 80 per minute, even during vigorous exercise, it is only about 130 times; and the chest fluctuations caused by breathing are usually about 20 to 30 per minute, and the shortness of breath is only 60 About twice, so the detection of human vital signals is actually the detection of low-speed moving targets. When the human emotion is stable, the frequency of heartbeat and breathing basically maintains in a stable range and changes periodically.
For life signals, in many cases, irregularities will also appear. In general, in order to simplify the analysis, the target signal of the human body can be assumed to be a sinusoidal oscillation signal with a periodic frequency. In fact, chest movements and heartbeats caused by human breathing are not sinusoidal. Moreover, due to the differences between people, the parameters of life signal amplitude and frequency of different people are also different. Even for the same person, some parameters will change under different circumstances. For example, when a person is frightened, breathing will speed up, resulting in the amplitude of the breathing signal
And frequency increased.
2 Jump breathing model simulation
2.1 Sinusoidal oscillation model
Generally, in the field of life detection, heartbeat and breathing models can be represented by two sinusoidal oscillation functions:
Among them, A1 and A2 are the amplitude of breathing and heartbeat; w1 and w2 are the frequency of breathing and heartbeat; θ2 is the constant phase.
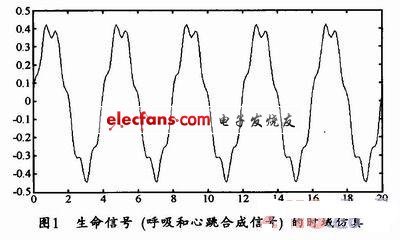
If the frequency and amplitude parameters of respiration and heartbeat are set as: A1 = 0.4cm, A2 = 0.05cm, w1 = 1.57rad, w2 = 9.42rad, θ2 = 0.956. Then, the time domain model of heartbeat breathing obtained from the above setting parameters and through matlab software is shown in Figure 1.
2.2 Use the least square method to curve fit the measured waveform
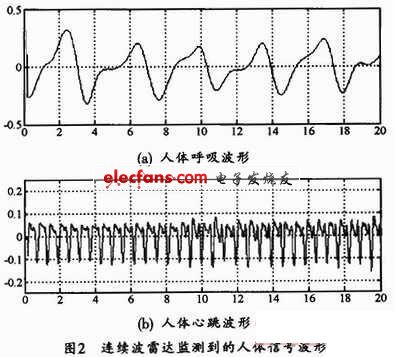
Despite the diversity and differences in human life signals, the physiological characteristics of the human body determine the regularity of human breathing and heartbeat activities. Sometimes, the heartbeat breathing signal that people need is relatively complicated. At this time, the simulation can be carried out according to the measured waveform. Figure 2 shows the human breathing and heartbeat signals obtained by 34GHz linear continuous wave biological radar in free space.
It can be seen from Figure 2 that the heartbeat and breathing waveforms of human body monitored by continuous wave radar have two maximum values ​​and one minimum value in a single cycle. Taking a heartbeat signal as an example, in a single cycle, the signal changes slowly, and the inflection point on the waveform corresponds to the heartbeat process of the human body, and can be used as a characteristic point for identifying the heartbeat signal. Among them, the two maximum values ​​are caused by the periodic contraction and relaxation of the atria and ventricles.
According to the measured waveform of human breath monitored by continuous wave radar (ie, Figure 2 (a)), select the characteristic points that can reflect the change of the waveform on a single periodic waveform as follows:
x1 = [0 0.25 0.5 0.75 1 1.25 1.5 1.75 2 2.25 2.5 2.75 3 3.1];
y1 = [-0.24 -0.23 -0.1 1 -0.01 0.03 0.015 0.1 0.2 0.29 0.315 0.24 0.1 -0.2 -0.26];
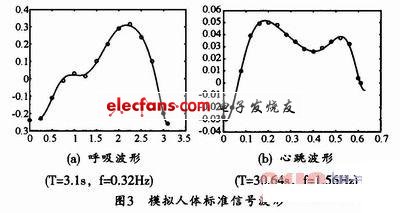
Then use the least squares curve fitting method, and use the MATLAB software to obtain the single-cycle standard human body breathing waveform as shown in Figure 3 (a). The characteristic points are marked with circles in the figure.
Similarly, according to Figure 2 (b), the following characteristic points can also be taken:
x1 = [0 0.04 0.08 0.12 0.16 0.2 0.24 0.28 0.32 0.36 0.4 0.44 0.48 0.52 0.56 0.6 0.61];
y1 = [-0.028 -0.02 0.01 0.039 0.049 0.05 0.048 0.04 0.034 0.028 0.026 0.029 0.034 0.037 0.032 0.004 0];
At the same time, the least squares curve fitting is also used, and the resulting single-cycle human body standard heartbeat waveform is shown in Figure 3 (b).
Controller,video processor,led display controller
Guangzhou Chengwen Photoelectric Technology co.,ltd , https://www.cwleddisplay.com