
Synthetic Aperture Radar (SAR) imaging is less affected by the weather and is not restricted by day and night, so it has broad application prospects in the fields of navigation and military. The concept of ring-sweep SAR was proposed by KLAUSING H et al. in 1990 [1]. Compared with traditional linear SAR, it has 360° imaging field of view, high azimuth resolution and scanning speed, and achieves wide-area imaging in a short time. The advantages of the effect [2-4] have broad application prospects. Compared with traditional pulse SAR, Frequency Modulated Continuous Wave (FMCW) SAR has the advantages of light weight, low transmission power [5-6], high concealment and high resolution. The ring-sweep SAR under the FMCW system combines the advantages of both, and has practical significance for its imaging system research.
Based on the FMCW ring sweep SAR radar system, this paper proposes a target distance imaging system design and its test method. The design is designed with multiple modes based on the actual resolution and detection distance, each corresponding to a specific waveform parameter. According to the FMCW system, the distance of the target is obtained by demodulating the image to obtain the beat signal of the target echo, and the frequency of the signal is analyzed to obtain the final result [7]. Since the echo signal required by the analog front end requires high resolution, the amount of data for frequency analysis is huge. To meet the requirements of real-time data processing, the imaging system is demodulated by the analog front end, and the obtained analog signal is sampled and quantized. The digital signal [8] is sent to the FPGA digital down-conversion process to obtain the target distance to the imaging data.
In this paper, MATLAB is used to simulate the demodulation signal of the target echo of a certain working mode, and the distance data is obtained by digital down-conversion of the FPGA. The distance parameter represented by the working mode of the MATLAB observation signal spectrum confirmation and design is consistent. After obtaining the consistency result, the demodulated signal with the target distance of 0 is obtained by the closed-loop method of the analog front end and loaded into the FPGA, and the spectrum is verified to verify the feasibility and correctness of the imaging system.
1 design principle
1.1 Radar waveform parameter design
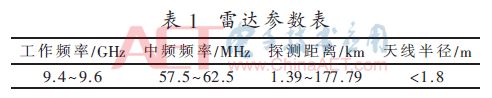
The FMCW ring sweep SAR radar system is mainly composed of a transmitter, a frequency synthesizer, a receiver, a signal processing board, a turntable and a transmitting and receiving antenna. The frequency synthesizer receives the waveform configuration parameters from the host computer to generate the RF signal and the local oscillator signal with the corresponding frequency range of 9.4~9.6 GHz. The former is sent to the transmitter for amplification and then sent to the free space through the transmitting antenna, and the latter is sent to receive. The machine performs the derating frequency and demodulation processing with the echo signal from the receiving antenna to obtain an intermediate frequency signal of 57.5~62.5 MHz, and then sends the intermediate frequency analog signal to the signal processing board for distance imaging processing. The radar parameters are shown in Table 1.
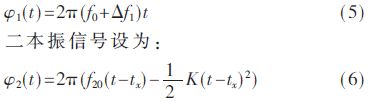
According to different resolution and detection distance requirements, the transmit and receive waveform parameters in 10 working modes are designed in the FMCW system. The radar transmit waveform can be expressed as:

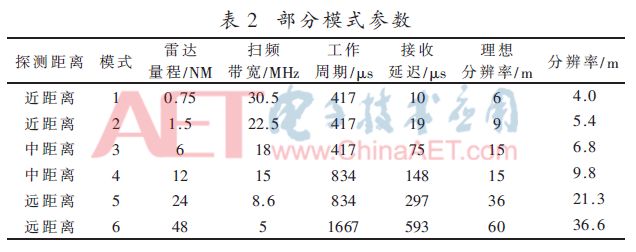
Where f0 is the carrier frequency of the signal, K=-B/T is the frequency modulation slope of the signal, B is the bandwidth of the signal, and T is the sweep period of the signal, which is also the duty cycle of the signal. Select the waveform parameters that can represent the three detection distances of near, medium and far, respectively, as shown in Table 2.
1.2 Radar waveform parameter analysis
In order to achieve the high resolution of the range, the FMCW distance processing uses the beat frequency Fourier transform technique to reduce the sampling rate. The range of the beat frequency is determined by the nearest and farthest slant range. The distance resolution is only related to the transmitted signal bandwidth. The larger the bandwidth, the higher the distance resolution.
The maximum swept bandwidth of the radar transmit waveform is B=30.5 MHz, and the ideal range resolution is:

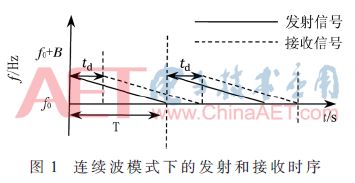
During the whole working cycle, the FMCW signal is always transmitting, and the receiving time has a time delay td (different in different working modes) relative to the transmission. The timing is as shown in Fig. 1, T is the working period, and B is the sweeping bandwidth.
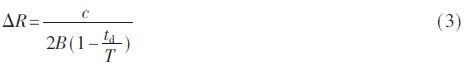
After considering the effect of the echo delay, the target distance resolution is:
In the FMCW system, there are different distance resolutions at different detection distances. The further the distance, the worse the resolution. The parameters given in Table 2 verify this conclusion.
2 distance to imaging system design
2.1 FMCW distance imaging principle
The beat frequency Fourier transform technique is one of the pulse compression methods. The principle is to multiply the echo chirp signal and the conjugate of the chirp reference signal with the same frequency modulation slope [9-10] (demodulation processing) to obtain the target beat signal, and analyze the difference by spectrum analysis. The frequency of the signal is taken to achieve the purpose of pulse compression.
According to equation (1), a delay echo can be obtained:

Where Ï„=2d/c is the delay caused by the echo caused by the target relative to the transmitted wave.
The ring-sweep SAR receiving system uses two-stage mixing to obtain an intermediate frequency signal, one-stage mixing is used to reduce the signal frequency, and the second-level mixing is used to demodulate the frequency.
Regardless of the amplitude effect, a local oscillator signal phase is set to:
Where Δf1 is the carrier frequency difference between a local oscillator and the main oscillator, f20 is the carrier frequency of the two local oscillators, and tx=2Rmax/c is the two local oscillator update pulse delay, which is determined by the detection distance. The relevant parameters are shown in Table 2 for reception. Delay parameter.
The received signal is phased by two stages to obtain the IF signal phase:
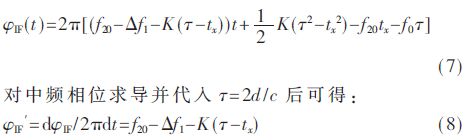
It is known from the above equation that the frequency of the echo signal is related to the delay tx, that is, related to the detection distance, and the frequency of the intermediate frequency signal can be obtained by performing FFT on the intermediate frequency signal [11].
2.2 Digital System Design
The demodulation process is done in the receiver to obtain an analog IF signal. In order to enable distance imaging processing in the FPGA, an AD acquisition module is added between the receiver and the FPGA. Figure 2 shows the four major components of the FMCW system distance-oriented imaging method: demodulation, AD acquisition, digital down conversion (DDC), and Fourier transform (FFT). The demodulation module is completed in the receiver, and the AD acquisition, DDC and FFT modules are all implemented by the FPGA.

The AD acquisition module converts the analog IF signal into a digital signal. DDC mainly implements the shifting and deceleration processing of the spectrum, and obtains baseband signals, including NCO, CIC decimator, mixer and FIR filter. The digital echo signal is obtained by bandpass sampling, and the NCO generates two orthogonal local oscillator signals to be supplied to the mixer. The mixer obtains the product of the local oscillator signal and the digital echo signal, and the signal is moved to the baseband at this time, CIC The decimator performs the deceleration processing on the baseband signal, that is, extracts by multiples, and then obtains the required frequency band signal through the FIR filter, and finally performs FFT transformation.
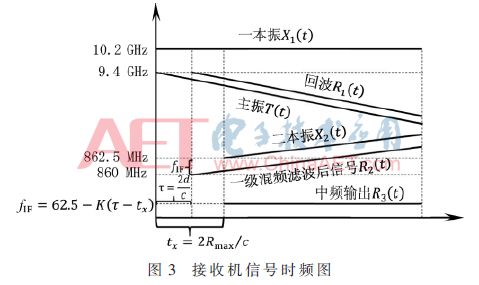
When the receiving antenna receives the reflected signal of the target, it is sent to the receiver to perform FM processing. According to equation (8) and the ring sweep SAR, the carrier frequency f0 has three types of 9.2 GHz, 9.4 GHz and 9.6 GHz in the actual situation of the FMCW system, and the frequency difference Δf1=800 MHz and the two local oscillator carrier frequency f20=862.5 MHz are used. The receiver IF signal can be expressed as:

Taking the carrier frequency of 9.4 GHz as an example, the time-frequency diagram of the internal signal of the receiver is given, as shown in Figure 3.
To simulate the subsequent module imaging method, the signal generator is used to simulate an IF output center frequency of 60 MHz with a bandwidth of 5 MHz. Set the bandpass sampling frequency to 48 MHz. After sampling, the center frequency of the IF signal becomes 12 MHz, the bandwidth is unchanged, and it is sent to the DDC.
The NCO is designed to generate a 12 MHz sine wave local oscillator signal, and the single signal of the real signal sample is orthogonally mixed to obtain two signals of I and Q, and then a low-pass filter is used to filter out the high-frequency component generated by the mixing. Baseband signal with in-band frequency range from -2.5 to 2.5 MHz. In order to reduce the pressure of subsequent signal processing, the baseband signal is decelerated by the CIC decimator, and the specific decimation value is determined according to the working mode. After the obtained signal is sent to the low-pass filter for filtering and shaping, it is judged whether the output data satisfies 8 192 points. If the number of bits is less than 8 192, the signal is zero-padded. If 8 192 points are satisfied, zero-padding is not performed. After completion, the 8 192 points data is subjected to FFT transformation, and the azimuth imaging distance element needs to be sent to the DSP for subsequent processing.
3 distance imaging test method
3.1 FPGA and MATLAB board level system simulation
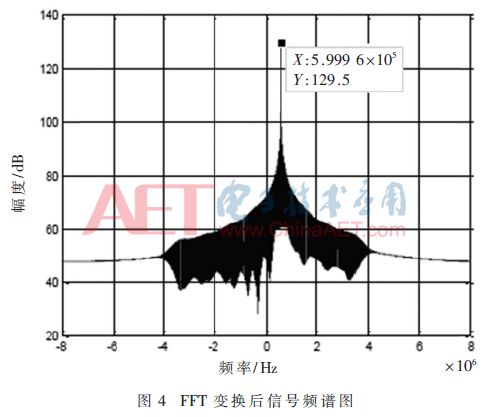
In the simulation, a 11.4 MHz sine wave is generated with the NCO as the signal source, and the intermediate frequency signal of the analog receiver output is 59.4 MHz. The NCO produces a local oscillator signal of 12 MHz. After mixing, the difference frequency signal is -0.6 MHz, and the sum frequency signal is -23.4 MHz. After passing through the low-pass filter, the difference frequency signal -0.6 MHz required after mixing is preserved. The CIC extraction selects the working mode 1, and the extraction multiple is 3, achieving 3 times the deceleration processing. After the FFT transform, I and Q signals are generated, and the data is imported into MATLAB. The simulation results are shown in Fig. 4.
3.2 FMCW distance to imaging board level closed-loop test
In the field test, the microwave source generates a clock of 48 MHz required by the signal processing board, and generates a local oscillator and two local oscillator signals required by the receiver according to the waveform parameters. Because it is a closed-loop test, the main vibration signal generated by the microwave source is used as the input of the receiver, and the receiver is connected to the 30 dB attenuator to avoid damage to the receiver due to excessive signal. Consistent with the simulation, taking the working mode 1 as an example, the measured results of the distance from the FMCW ring-scan SAR system to the imaging plate level are given.
The intermediate frequency signal after the FM processing in the receiver is input to the signal processing board AD for acquisition. According to equation (9), due to the closed-loop test, the echo delay Ï„ = 0, the receiver outputs the intermediate frequency signal frequency of 61.77 MHz. The receiver IF output is directly connected to the spectrum analyzer for observation, as shown in Figure 5.
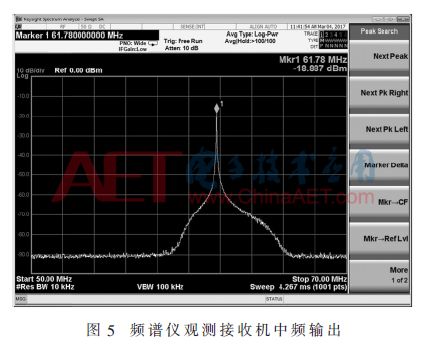
Use Signal Tap to capture AD acquisition, DDC modules and FFT output data, and import it into MATLAB to get the signal spectrum as shown in Figure 6. The IF signal is sampled by bandpass to obtain a 13.77 MHz signal, and the NCO produces a 12 MHz local oscillator signal. The mixing results in two frequencies of 1.77 MHz and -25.77 MHz. Due to the crosstalk of the local oscillator signal, there is a 12 MHz crosstalk signal after the mixing. After the filtered output, the crosstalk local oscillator signal is filtered out. When the CIC filter is in operation mode 1, the extraction multiple is 3, the data rate after extraction is 1/3 of the original signal, the signal frequency remains unchanged, and the spectrum of the extracted and filtered output signals is as shown in Fig. 6. Finally, the FFT is used to obtain the signal distance. Spectrum.
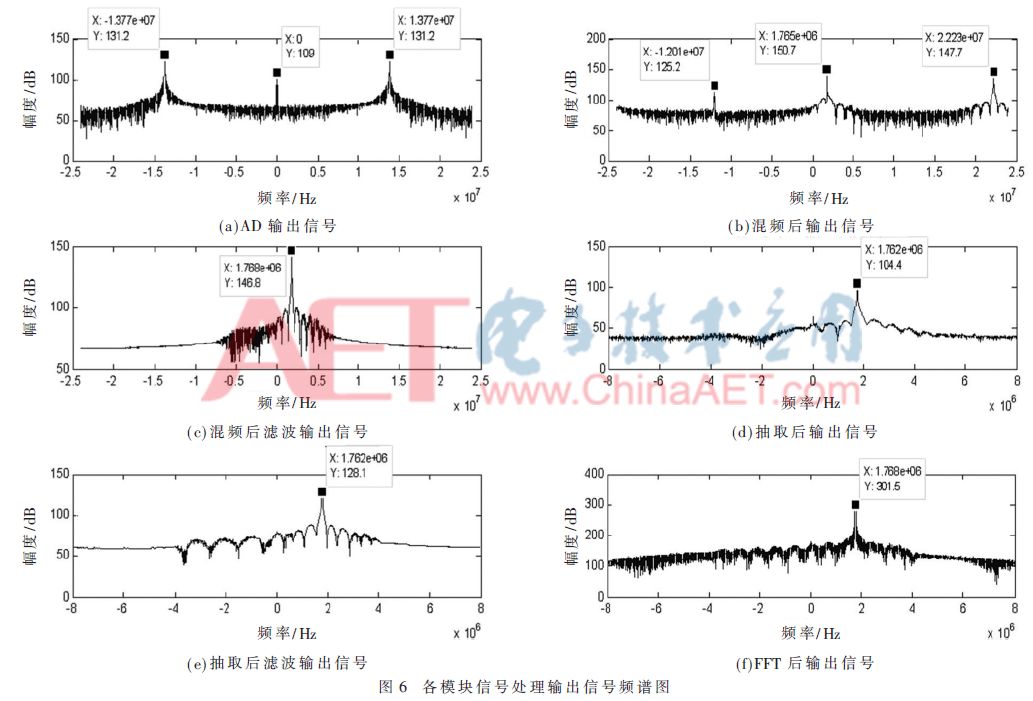
According to the results of the spectrum analyzer, the receiver IF signal frequency is 61.769 MHz, the bandpass sampling gives 13.769 MHz signal, and the DDC obtains 1.677 MHz baseband signal. The actual signal frequency is 1.768 MHz, converted to a distance of -1.2 m according to equation (9), and the distance resolution of operating mode 1 is 5 m, with the error being within the allowable range.
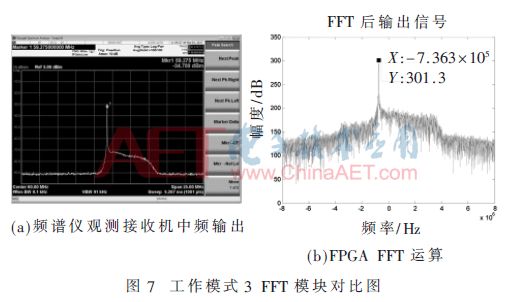
In order to verify that the system can be applied to multi-mode scenes, the closed-loop measured results representing the medium distance and long-distance modes are respectively given and compared with the receiver output value spectrum analyzer observations. According to Table 2, test mode 3 and work mode 5 are selected.
In the medium distance mode of operation 3, the theoretical value of the receiver's intermediate frequency output is 59.263 MHz, and the baseband signal of -0.737 MHz is obtained by DDC. The actual signal frequency is -0.736 MHz, which is converted into a distance of 4.9 m and a distance resolution of 6.8 m. Error requirements. The comparison between the FFT module output and the receiver directly connected to the spectrum analyzer is shown in Fig. 7. Fig. 7(a) shows the receiver output access spectrum analyzer, and Fig. 7(b) shows the FFT output.
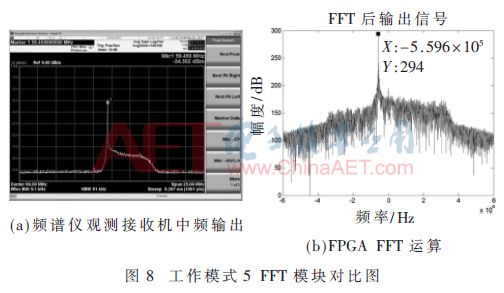
In the long-distance working mode 5, the receiver IF output theoretical value is 59.437 MHz, the actual value is 59.275 MHz, the DDC obtains the -0.563 MHz baseband signal, the actual signal frequency is -0.559 6 MHz, converted to a distance of 43.49 m, the distance resolution It is 36 m. Close to the difference of three distance elements, the difference between this actual value and the theoretical value is due to the systematic error of the intermediate frequency output, which needs to be corrected later. The comparison between the FFT module output and the receiver directly connected to the spectrum analyzer is shown in Fig. 8. Fig. 8(a) shows the receiver output access spectrum analyzer, and Fig. 8(b) shows the FFT output.
4 Conclusion
In this paper, a design and test method of imaging system based on FMCW ring-sweep SAR is proposed for the target distance detection of FMCW ring-sweep SAR. The design includes demodulation processing, AD acquisition, DDC and FFT module design. The hardware circuits such as NCO, mixer, CIC decimator and FIR filter are built in the FPGA, and the program is downloaded for simulation and board level test. The collected data is sent to MATLAB to generate the distance spectrum spectrum and analyze. The on-site closed-loop test is performed after the simulated board level test achieves the intended purpose. The test results show that the system realizes the circumferential scanning SAR distance imaging under the FMCW system.
Draw-wire sensors of the wire sensor series measure with high linearity across the entire measuring range and are used for distance and position measurements of 100mm up to 20,000mm. Draw-wire sensors from LANDER are ideal for integration and subsequent assembly in serial OEM applications, e.g., in medical devices, lifts, conveyors and automotive engineering.
Linear Encoder,Digital Linear Encoder,Draw Wire Sensor,1500Mm Linear Encoder
Jilin Lander Intelligent Technology Co., Ltd , https://www.jllandertech.com