
Radio engineering applications not only measure the harmonics of the RF signal, but sometimes the total harmonic distortion (THD) of the audio signal. The RF signal may be a modulated signal or a continuous wave signal. These signals can be generated by a drifting voltage controlled oscillator (VCO) or a stable phase-locked oscillator or synthesizer. Modern spectrum analyzers can perform these measurements using the methods described herein. This article also discusses how to determine whether harmonics are generated in an analytical device or device under test (DUT), the best measurement method for different types of signals, and the utilization of log-average, voltage unit, and rms (ms) calculations.
All of the signals we process here are assumed to be periodic signals, that is, their voltage characteristics over time are repeated. Fourier transform analysis can represent any repetitive signal as the sum of several sine waves. The sine wave with the lowest frequency generated according to a certain purpose is called the fundamental frequency signal. Other sine waves are called harmonic signals. A spectrum analyzer can be used to measure the amplitude of the fundamental frequency signal and its harmonic signals.
Harmonics are often undesirable. In radio transmitters, they may interfere with other users of the radio frequency spectrum. For example, in the local oscillator (LO) of a heterodyne receiver, harmonics may generate spurious signals. Therefore, they should usually be monitored and reduced to a minimum.
When a signal is measured with a spectrum analyzer, the analyzer's circuitry also introduces some of its own distortion. In order to make accurate measurements, the user needs to know whether the measured distortion is part of the signal being examined or due to the introduction of the analyzer.
The distortion produced by the analyzer is due to some weak nonlinear characteristics (because it does not have ideal linearity). Therefore, the signal processing characteristics of the spectrum analyzer can be represented by a Taylor series indicating the relationship between the output voltage (O) and the input voltage (I):
V0=K1Vi+K2Vi2+K3V3i............(1)
In the formula, V0=output voltage, Vi=input voltage, K1, K2 and K3 are constants. Using the above relationship, it can be directly proved that doubling the input voltage will cause the Vi2 term to increase by 4 times (6dB), thus causing a sine wave. The second harmonic response is increased by a factor of four. Similarly, third-order harmonic distortion increases with the input level in a cubic manner. There are two ways to rely on technical indicators or experiments to determine if the analyzer has an effect on the measured distortion.
In order to judge the influence of the analyzer based on the harmonic distortion specification, the knowledge of the distortion level is used to convert those technical indicators given by the gamma with respect to the specific signal on the analyzer input mixer to the selected input. The level gives the dBC. Figure 1 shows a graphical example of this process. As can be seen from the figure, only second-order distortion and third-order distortion are specified for the spectrum analyzer. Higher order distortions are usually negligible.
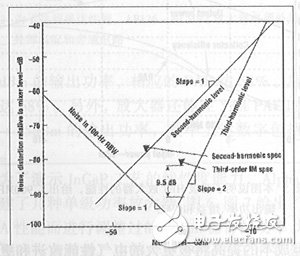
Figure 1 The distortion limit of the spectrum analyzer can be plotted for the second and third harmonic levels, respectively.
Note that the third-order harmonic distortion of the parameter of interest is different from the third-order intermodulation distortion (IMD3) of the specified parameter.
In the unselected frequency band, the third-order harmonic distortion should be 9.5 dB lower than the weak nonlinear intermodulation (IM) component. This relationship can be represented by the above mentioned (4) for Acos(xt)+Bcos(yt) of Vi, and the IM term such as cos[(x-2y)t] and harmonic terms such as cos(3xt) ) Compare to export. If the front end gain varies between the fundamental and third harmonic signals, there will be the same amount of change in the relationship between the IM and the harmonic levels produced by the observed analyzer. If the third harmonic is in the preselected band, it will be much lower than the specified IM component because the preselected filter keeps the fundamental signal unaffected by the front end nonlinearity.
It is easier to experimentally judge whether the analyzer will introduce distortion. Simply increase the input attenuation and observe if the distortion level has changed. If a change occurs, the analyzer has an effect on the measured distortion.
Although the analyzer's effect on the measured harmonics can be reduced by simply increasing the input attenuation, this reduces the signal-to-noise ratio (SNR), which limits the analyzer's ability to measure low harmonic levels. However, the measurement of signals close to the noise floor can be improved by a logarithmic averaging method.
The spectrum analyzer can reduce the change in measurement results by averaging the measurement results. One form of averaging is to average several data traces of the analyzer screen. Another form is video filtering. When the averaging operation is completed, it is important to know the amplitude scale at which the averaging is taken. When video filtering or trace averaging is done on a signal displayed on a logarithmic scale, the result is the average of the logarithm of the signal. Alternatively, the averaging can be done on a linear (voltage) scale. Some analyzers can average on the power (rms voltage) scale. Analyzers based on Fast Fourier Transform (FFT) are typically only averaged over the power scale.
It is well known that for the above three scales, the measured pure noise levels are not the same. Among them, the logarithmic scale noise is underestimated by 2.51dB. Undoubtedly, the logarithmic scale is best suited for measuring low harmonic levels because it gives the signal level that is least affected by the noise floor. Therefore, logarithmic scales should be used to measure harmonic levels and reduce video bandwidth or increase the average as needed.
The ideal repetitive signal discussed above does not exist in reality. The two major deviations from the ideal situation are drift and modulation. Drift signals from an unlocked voltage controlled oscillator (VCO) can cause measurement difficulties. The drift may be so large that in order to measure a certain harmonic it is necessary to scan the entire frequency range possible and to use a peak detector to measure the harmonic level. For this high variability of frequency, averaging may cause errors and should not be used. In addition, peak detection is particularly suitable for detecting noise, so when measuring with this sweep-peak detection method, the analyzer's measurement range is compromised. Despite this, such solutions are still very useful and are used in some spectrum analyzers, such as the Agilent Technologies 8560E series, which is equipped with the company's 85672A parasitic response measurement application.
The modulated signal is also a measurement problem. When the signal is modulated, its spectral width increases. Therefore, a sufficiently wide resolution bandwidth must be used to respond to all of the energy in the signal. Using a wide bandwidth will increase the noise floor, thereby reducing the available dynamic range. The spectral width of the signal using frequency modulation (FM), pulse modulation (PM), and ordinary digital modulation formats increases in proportion to the number of harmonics. Therefore, it is recommended to increase the resolution bandwidth for harmonic numbers.
The modulated signal is almost always a phase-locked signal. Therefore, one possible solution is to carefully measure the fundamental frequency using a frequency counter. Then, use the spectrum analyzer's zero-frequency interval analysis function to find all harmonic signals on the expected harmonics. Zero-frequency interval analysis (the way the analyzer does not scan) is the best way to analyze because it averages all the scanned data, not just the peak amplitude. Agilent Technologies' ESA Series spectrum analyzers (Figure 2) use a zero-frequency interval counting and averaging solution with a proportionally varying resolution bandwidth. Although this solution is not as perfect as the scanning peak detection solution, it can quickly achieve very small discrete results and is suitable for working with a modulation source.
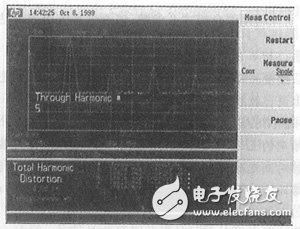
Figure 2 The built-in “harmonic†measurements of the spectrum analyzer show data sheets with individual harmonic levels (dBc) and calculated total harmonic distortion (THD) results.
The sum of the amplitudes of all harmonics is a quality factor commonly used in audio products. It is also known as total harmonic distortion (THD). Total harmonic distortion is based on power addition rather than voltage addition. THD is defined as:
THD=100%&TImes;(nmaxn=2&TImes;E2n)0.5/Ef (2)
Where: En = nth harmonic voltage, Ef = fundamental frequency voltage nmax = the highest harmonic number to be investigated (in many cases, nmax is limited to 10. In other cases, nmax is the highest number not exceeding 20 kHz Harmonics, the upper limit of the audio range)
The three scales that may be averaged, voltage, logarithm or power, are discussed above. Attention should be paid to the relationship between THD measurements and these scales. The data is best collected and averaged on a logarithmic scale. THD calculations are calculated as the square root of the sum of squares (RSS), which is related to RMS or power calculations. However, the result is calculated from the voltage and the percentage refers to the voltage percentage.
In summary, RF and audio harmonics and THD can be measured by a spectrum analyzer using the method described. In some frequency harmonic analyzers, the implementation of these measurements has been automated in order to speed up the measurement.
In this category, we introduce an energy electronic cigarette, it is added with caffeine and other substances to help refresh you, and not nic.
When you feel sleepy, taking a sip will reduce your drowsiness, which is simpler than sparkling coffee.
We are China leading manufacturer and supplier of Disposable Vapes puff bars, energy e-cigarette pen,energy e-cigarette kit,
energy e-cigarette device, and e-cigarette kit, and we specialize in disposable vapes, e-cigarette vape pens, e-cigarette kits, etc.
energy e-cigarette pen,energy e-cigarette kit,energy e-cigarette 0 nic,energy e-cigarette device,energy e-cigarette vaporizer
Ningbo Autrends International Trade Co.,Ltd. , https://www.supermosvape.com